

LOD answers “is the analyte there at all?” LOQ answers “how much of it is there, reliably?” That distinction, not the acronyms themselves, is what determines whether a result belongs in a report or gets censored as “not detected.”
For methods derived from the same blank standard deviation (σ) and calibration slope, a working rule holds: LOQ ≈ 3 × LOD, using the conventional 3.3σ/slope and 10σ/slope multipliers set out in the foundational review by Armbruster and Pry. LOQ is always at least as large as LOD, never smaller.
- LOD tells you whether an analyte is present above background noise.
- LOQ tells you whether its concentration can be measured with acceptable precision and accuracy.
- When both derive from the same σ and slope, LOQ is generally higher than LOD by a notable multiple.
- Report quantitative results only above LOQ; anything between LOD and LOQ should usually be censored as “< LOQ”, not stated as a number.
Key Takeaways
Getting LOD and LOQ right depends on choosing the correct variance source, confirming calculated limits experimentally, and reporting values below LOQ as censored rather than numeric.
| Point | Details |
|---|---|
| LOD answers presence, LOQ answers amount | Use LOD for screening decisions and LOQ for any reportable quantitative result. |
| LOQ ≈ 3 × LOD | Applies when both derive from the same σ and slope using 3.3 and 10 multipliers. |
| Censor values between LOD and LOQ | Report as “< LOQ” rather than a number, since relative uncertainty often exceeds 30%. |
| Watch for heteroscedasticity | Build a precision profile or use weighted regression when SD grows with concentration. |
| Validate reagents before validating methods | ABMIUM’s verified reagents and independent validation services reduce reagent-driven variance in LOD/LOQ work. |
Table of Contents
- LOD vs LOQ: definitions and the LoB, LOD, LOQ hierarchy
- Why LOD and LOQ answer different questions
- How to calculate LOD and LOQ: the accepted formulas
- A worked HPLC example: calculating LOD and LOQ step by step
- When variance breaks the simple LOD and LOQ formulas
- Validating and reporting LOD and LOQ in the laboratory
- Common mistakes in LOD and LOQ work
- A one-page LOD and LOQ validation checklist
- What I’ve learned validating LOD and LOQ across different assay types
- How ABMIUM supports reliable LOD and LOQ determination
- Sources
- FAQ
LOD vs LOQ: definitions and the LoB, LOD, LOQ hierarchy
Three thresholds sit in a fixed order: LoB ≤ LOD ≤ LOQ. Each answers a different question, and conflating them is one of the most common errors in method validation.
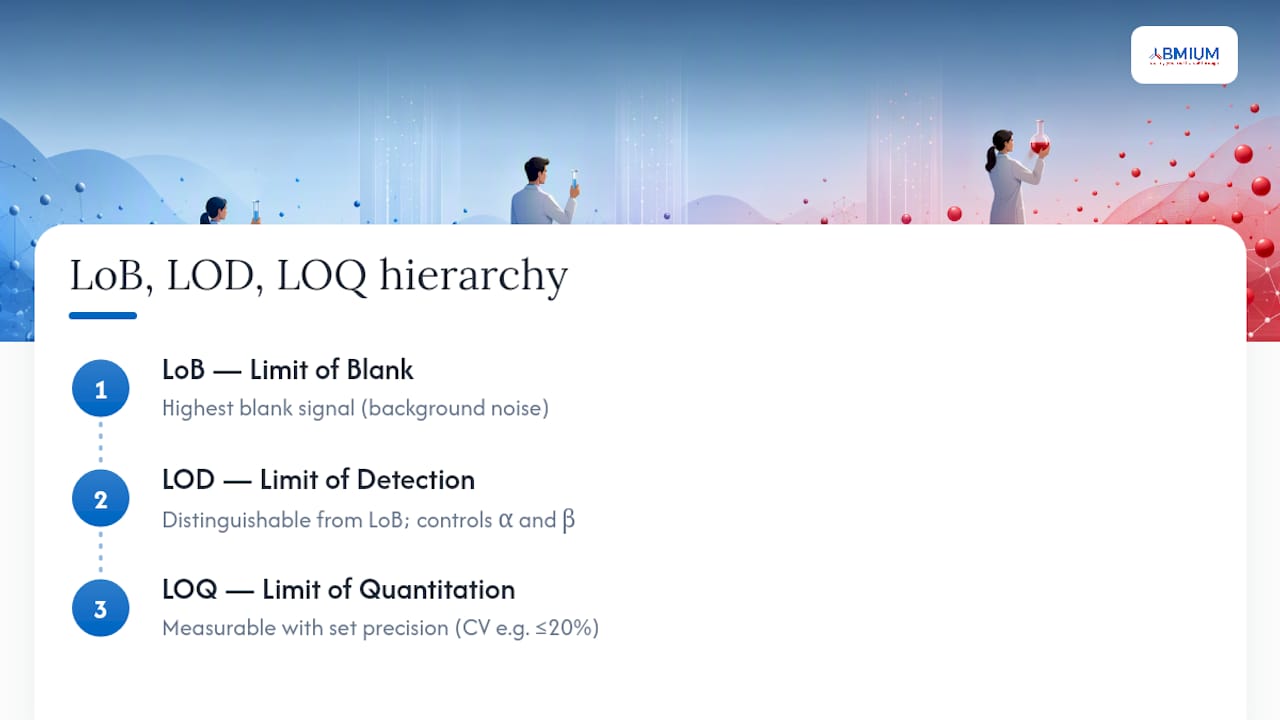
Limit of blank (LoB) is the highest apparent signal expected from a blank sample, purely due to background noise. It sets the statistical ceiling for “nothing there.” Limit of detection (LOD) is the lowest concentration that can be reliably distinguished from that blank noise. It builds on LoB by also accounting for variance in low-concentration samples themselves, not just the blank. Limit of quantitation (LOQ) is the lowest concentration that can be measured with acceptable precision and accuracy, sufficient to report a defensible number rather than a “detected/not detected” call.
The hierarchy exists because each threshold protects against a different statistical error. LoB and LOD are governed by α, the false-positive rate (calling a blank “positive”), and β, the false-negative rate (calling a real low-level sample “blank”). The PMC review on LoB, LOD and LOQ frames LOD as the concentration at which both error types are controlled to an acceptable level, commonly 5%.
LOQ adds a third requirement on top of detection confidence: a stated precision goal. A coefficient of variation (CV) threshold of 20% is common for many bioassays, while small-molecule chromatographic methods often target CV ≤ 10%. An LOQ value quoted without its precision target is, frankly, incomplete. That is the core reason LOQ sits above LOD in the hierarchy rather than being interchangeable with it: it is not just a lower detection threshold, it is a measurement quality threshold.
Why LOD and LOQ answer different questions
Detection and quantification are not two points on the same scale. Detection is a binary decision: is the analyte present, yes or no? Quantification is a measurement claim: what is the concentration, and how much do you trust that number?
That difference drives which limit matters for which task:
- Screening assays (drug-of-abuse panels, pathogen presence/absence tests) care about LOD. A “positive/negative” call is the deliverable.
- Regulatory and compliance reporting almost always requires LOQ, because a regulator or client needs a defensible concentration, not a threshold crossing.
- Environmental limits (maximum contaminant levels in water or soil) are typically set against LOQ, since enforcement decisions hinge on a measured value compared against a legal limit.
- Bioanalysis and pharmacokinetics depend on LOQ almost exclusively; a drug concentration curve built from LOD-level guesses would be scientifically indefensible.
Quoting a method’s LOD when a study design or regulator requires LOQ overstates the assay’s real capability. A lab that reports “detected at 0.5 ng/mL” using LOD language, when its LOQ is actually 1.5 ng/mL, has implied a precision the data cannot support. CASRAI’s guidance on LOD and LOQ calculation notes this exact confusion as a recurring cause of failed audits and disputed results.
How to calculate LOD and LOQ: the accepted formulas
Three calculation families dominate the literature, and they do not always agree numerically on the same dataset.
Blank-based method. LoB and LOD are estimated directly from repeated blank measurements:
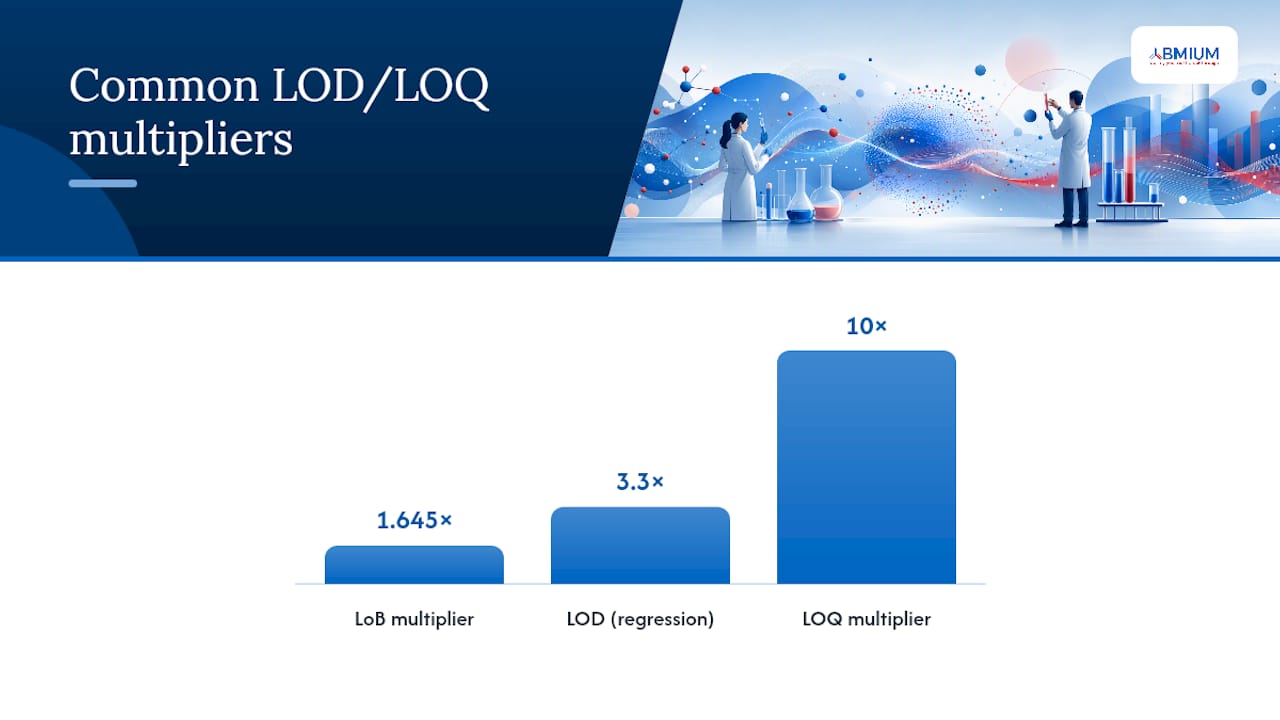
- LoB = mean(blank) + 1.645 × σ(blank)
- LOD = LoB + 1.645 × σ(low-level sample)
- LOQ = LoB + 10 × σ(low-level sample), or more simply, 10 × σblank / slope in regression form
Calibration-curve (regression) method. Using the calibration slope (S) and either the residual standard deviation of the regression or the standard deviation of low-concentration replicates (σ):
- LOD = 3.3 × (σ / S)
- LOQ = 10 × (σ / S)
These multipliers, 3.3 and 10, are conventions, not universal constants. The IUPAC analytical compendium on detection and quantification limits is explicit that fixed multipliers like 3, 3.3 or 10 only hold under specific statistical conditions; different degrees of freedom or unequal α/β require correction factors.
Signal-to-noise (S/N) method. Common in chromatography during method development: LOD is set where S/N ≈ 3, and LOQ where S/N ≈ 10. It is fast and needs no separate blank study, but it measures instantaneous baseline ripple within a single trace. Run-to-run blank standard deviation usually captures more real-world noise, so S/N-based limits tend to underestimate LOD and LOQ compared with blank-SD methods.
A related but distinct set of terms appears in regulatory environmental and clinical work: MDL (method detection limit), IDL (instrument detection limit) and PQL (practical quantitation limit). IDL measures pure instrument noise with no sample preparation; MDL incorporates the full method including extraction and matrix; PQL is often a regulator-set multiple of MDL chosen for routine believability rather than pure statistics. Regulators overseeing water and soil testing typically expect MDL, not IDL, because it reflects the whole analytical process.
A worked HPLC example: calculating LOD and LOQ step by step
Here is a reproducible example using a hypothetical HPLC assay for a small-molecule analyte, with both the blank-based and calibration-curve routes run on the same underlying data.
Raw inputs:
- Seven blank injections give a mean peak area of 120 units with a standard deviation (σblank) of 15 units.
- A calibration curve across 1 to 50 ng/mL gives a slope (S) of 42 area units per ng/mL.
- The residual standard deviation of the regression (σresidual) is 28 area units.
- Triplicate injections at a candidate low concentration (2 ng/mL) give a standard deviation of 0.18 ng/mL.
Blank-based calculation:
- LoB = 120 + (1.645 × 15) = 144.7 area units.
- Converting to concentration using the slope: LoB ≈ 144.7 / 42 = 3.44 ng/mL (as a signal-equivalent floor).
- LOD = LoB + (1.645 × 0.18 ng/mL low-level SD) ≈ 3.44 + 0.30 = 3.74 ng/mL.
- LOQ calculated using 10 times sigma over slope can underestimate real assay variance, so labs often use low-level replicate SD to estimate a more conservative LOQ.
Calibration-curve calculation:
- LOD = 3.3 × (σresidual / S) = 3.3 × (28 / 42) = 2.20 ng/mL.
- LOQ calculated from calibration curve residual standard deviation and slope can provide an estimate around a few ng/mL.
Note the two methods disagree on absolute values but preserve the roughly 3:1 LOQ-to-LOD ratio, exactly the pattern the PMC review describes. Neither number should be taken as final without experimental confirmation: prepare independent replicates at the candidate LOD and LOQ concentrations, run them across separate days if possible, and check that detection rate and %RSD meet the targets calculated on paper.
When variance breaks the simple LOD and LOQ formulas
The 3σ and 10σ multipliers assume one thing that often is not true: that standard deviation stays constant across the concentration range. When it does not, that is heteroscedasticity, and it invalidates a naive blank-based or single-point calculation.
Immunoassays, ELISA-based methods, and many biological matrices show standard deviation that grows with signal strength. A σ measured near zero concentration understates the real noise at concentrations closer to the LOQ, which means a calculated LOQ can look better on paper than it performs in practice. The analysis of LoB, LOD and LOQ from Analyse-it points out that default fixed-multiplier rules are frequently inappropriate for exactly this reason in immunoassay work.
Diagnosing it takes three checks:
- Plot residuals from the calibration regression against concentration; a widening funnel shape signals heteroscedasticity.
- Plot %CV (or raw SD) against concentration across the low-level range directly, rather than relying on a single blank measurement.
- Run a formal test (Breusch-Pagan or a simpler visual F-test comparing variance at low versus high concentration) if the funnel shape is ambiguous.
Once confirmed, three remedies apply. Transform the data (log transformation often stabilises variance for assays with multiplicative error). Use weighted least squares regression instead of ordinary least squares, weighting each calibration point inversely to its variance. Or build a full precision profile, plotting %CV against concentration across the entire working range, then setting LOQ at the concentration where %CV first crosses your stated goal (commonly 20% for immunoassays, 10% for chromatography), rather than trusting a single-point calculation.
Pro Tip: Never calculate LOQ from a single low-concentration replicate set. Run at least five independent preparations across two or three separate days before trusting the number for a report or regulatory submission.
Validating and reporting LOD and LOQ in the laboratory
A calculated LOD or LOQ is a hypothesis until it is confirmed experimentally. Validation and reporting should follow a consistent sequence.
- Prepare a minimum of seven blank replicates and at least seven low-concentration replicates near the candidate LOD, following CLSI EP17-A2-style guidance summarised by Analyse-it.
- Calculate LoB, LOD and LOQ using your chosen method (blank-based, regression, or S/N), and record which σ source you used.
- Confirm the candidate LOD experimentally: inject or prepare independent samples at that concentration and check the detection rate meets your target (commonly ≥95% true-positive detection).
- Confirm the candidate LOQ against your stated precision goal, typically %RSD or recovery within a defined band (for example CV ≤ 20% for many bioassays, CV ≤ 10% for chromatographic small-molecule methods).
- Document the full context: method used, σ source, number of replicates, matrix, instrument, analyst, and date of determination.
On a certificate of analysis or method validation report, useful phrasing looks like: “LOD determined as 2.2 ng/mL and LOQ as 6.7 ng/mL, calculated via calibration-curve regression (3.3σ/slope and 10σ/slope), confirmed by triplicate injection across three days, matrix: human plasma, analyst: [initials], date: [date].” That level of detail is what separates an audit-ready report from a number with no traceable basis.
Common mistakes in LOD and LOQ work
Several errors recur across laboratories, and most are avoidable with a documented procedure.
- Reporting a numeric result for a value that falls between LOD and LOQ, rather than censoring it as “< LOQ.” Relative uncertainty in that zone often exceeds 30%, so the number is misleading even if technically “detected.”
- Adopting a manufacturer’s published LOD/LOQ without re-validating it on your own instrument, column, and matrix. Limits are method-specific, not properties of the analyte alone.
- Confusing clinical sensitivity (true-positive rate in a diagnostic population) with analytical LOD (a statistical noise threshold). They answer different questions and are not interchangeable terms.
- Mislabelling LoB as LOD. LoB is the blank noise ceiling; LOD sits above it and accounts for additional low-level sample variance.
- Ignoring heteroscedastic noise and reporting an LOQ calculated from a single low-variance point, producing an optimistic number that fails in routine use.
A one-page LOD and LOQ validation checklist
Print this before your next method validation run.
- Prepare at least seven blank replicates and seven low-level sample replicates before calculating LoB, LOD or LOQ.
- Record which method (blank-based, regression, or S/N) and which σ source (blank SD, residual SD, or low-level replicate SD) generated the numbers.
- Confirm both limits experimentally with independent preparations, ideally across separate days.
- State the LOQ precision goal explicitly (for example, CV ≤ 20%) and record the acceptance criteria used.
- Re-validate LOD and LOQ whenever matrix, column, detector, reagent lot, or instrument changes, since these values are method-specific rather than fixed analyte properties.
What I’ve learned validating LOD and LOQ across different assay types
Applying these formulas across chromatography and immunoassay work makes one thing clear: the multiplier is never the hard part, the σ is. Choosing the wrong variance source, blank noise instead of low-level replicate variance, or a single-point SD instead of a full precision profile, quietly inflates confidence in numbers that will not hold up under audit.
Pro Tip: Always confirm LOQ experimentally with at least three independent preparations before it goes into a validated method or a client-facing report.
How ABMIUM supports reliable LOD and LOQ determination
Every formula in this article assumes clean, consistent reagent performance, and that assumption breaks down fast when antibody lots or reagent provenance vary between runs. ABMIUM addresses that directly: its catalogue of verified antibodies and research reagents comes with pre-purchase validation and documented provenance, so the variance you measure reflects your method, not an unverified reagent batch.

For labs building calibration curves or confirming candidate LOQ values, reagent-driven variability is exactly the kind of noise that inflates σ and pushes your reported limits higher than they need to be. ABMIUM’s independent validation services give you an extra layer of confidence before a reagent ever enters a validation run, and product pages such as the Anti-Human CD276 antibody list the data researchers need to assess fit before purchase. If your next method validation depends on getting LOD and LOQ right, start by choosing reagents whose performance is already documented.
Sources
Consult these for the underlying statistical and regulatory frameworks:
- Limit of Blank, Limit of Detection and Limit of Quantitation - PMC
- IUPAC analytical compendium — detection and quantification limits (Currie)
- LOD vs LOQ: How to Calculate Both — CASRAI
FAQ
What is the difference between LOD and LOQ?
LOD is the lowest concentration reliably distinguishable from background noise, a presence/absence threshold. LOQ is the lowest concentration measurable with acceptable precision and accuracy, a reportable quantitative threshold, and is typically about three times higher than LOD.
How do you calculate LOD and LOQ?
The most common approach uses a calibration curve: LOD = 3.3 × (σ/slope) and LOQ = 10 × (σ/slope), where σ is the residual standard deviation of the regression or the standard deviation of low-level replicates. Blank-based methods use similar multipliers applied to blank standard deviation instead.
What does LOQ mean on a lab report?
LOQ on a lab report marks the lowest concentration the method can quantify with a stated precision goal, commonly CV ≤ 20% or ≤ 10% depending on the assay type. Results below LOQ but above LOD should be reported as “< LOQ” rather than as a specific number.
What are the LOD and LOQ in HPLC?
In HPLC, LOD and LOQ are typically calculated from the calibration curve’s slope and residual standard deviation, using the 3.3σ/slope and 10σ/slope formulas, or from signal-to-noise ratios of approximately 3 and 10. Signal-to-noise methods tend to give lower, less conservative values than blank-based or regression approaches, so experimental confirmation with independent replicates remains essential.