

The hook effect in ELISA is a false-low or false-negative result caused by extremely high analyte concentrations overwhelming a one-step sandwich assay before it can form a proper antibody-antigen-antibody complex. When you see this, three actions matter more than anything else: run a serial dilution against the neat sample, compare the two results side by side, and correlate the finding with the clinical or experimental picture before you release a number.
The decision rule is simple enough to pin above a bench. If the diluted result reads higher than the neat result, suspect a hook effect and report the diluted value corrected for its dilution factor, not the neat one. If dilution brings the value down or keeps it roughly proportional, the hook effect is unlikely and something else, perhaps heterophile antibody interference, deserves a look instead.
Before escalating to a full investigation, work through this immediate checklist:
-
Repeat the assay with a 1:10 and a 1:100 dilution of the same sample, run alongside the neat result on the same plate.
-
Flag any result that contradicts strong clinical or imaging evidence, such as a large tumour with an apparently unremarkable marker, for hook testing rather than accepting it at face value.
-
Apply the higher-diluted-value rule as your first screen, then confirm with a wider dilution series if the analyte is known for very high physiological or pathological concentrations.
Key Takeaways
The hook effect gives falsely low ELISA results at very high antigen concentrations, and serial dilution combined with clinical correlation is the only reliable way to catch it before a wrong result reaches a clinician.
| Point | Details |
|---|---|
| Run the dilution check first | Compare neat versus 1:10 and 1:100 dilutions on the same plate before releasing an unexpected result. |
| Trust the diluted-higher rule | A diluted result reading higher than neat, once corrected for dilution factor, confirms hook effect. |
| Flag high-risk analytes | Apply reflex dilution automatically for prolactin, β-hCG, calcitonin, PSA, CA125, and cryptococcal antigen. |
| Favour two-step assay design | Choose two-step formats with a wash step where hook risk is known to be significant for that analyte. |
| Validate reagents before use | Abmium’s verified antibody sourcing and independent validation services help confirm high-dose behaviour ahead of routine testing. |
Clinical correlation remains the safety net behind every rule above: a result that does not match the clinical picture deserves a dilution check before it deserves a signature.
This article is general information, not a substitute for advice from a qualified doctor. Consult a qualified healthcare professional about your own circumstances before acting on anything here.
Table of Contents
-
How often does hook effect actually occur, and when should you suspect it?
-
How verified reagents and independent validation reduce hook-related errors
-
Getting hook-safe reagents and validation support from Abmium
Understanding the hook effect ELISA mechanism
The hook effect happens because a one-step sandwich ELISA asks capture antibody, sample, and detection antibody to compete for the same binding sites at the same time, and enormous antigen excess breaks that competition in the wrong direction.
In a properly working sandwich assay, antigen from the sample binds the capture antibody fixed to the plate, and free binding sites on that same antigen molecule are then occupied by a labelled detection antibody. Signal rises in step with concentration because more antigen means more sandwiches. That relationship holds only within the assay’s working range.
Push antigen concentration far enough, and the model breaks. This is the postzone effect, sometimes called antigen excess: so much free antigen floods the well that it binds detection antibody in solution before that antibody ever reaches a capture site on the plate. Antigen excess saturates both capture and detection antibodies simultaneously, preventing the sandwich complex from forming, and the wash step then strips away all that unbound, labelled antibody along with it. The result is a paradoxically low signal from a sample that actually contains a very high concentration of analyte, producing the characteristic bell-shaped, rather than monotonic, dose-response curve that gives the phenomenon its name.
A related but historically distinct phenomenon is the prozone effect, first described in classical serological agglutination testing, where excess antibody rather than excess antigen disrupts lattice formation. The mechanisms differ, but the practical consequence for a modern lab, a falsely reassuring low result, is the same, and the two terms are often used loosely and interchangeably in immunoassay literature.
The hook effect is almost exclusive to one-step heterogeneous sandwich formats. Simultaneous exposure of sample and both antibodies lets excess analyte occupy detection antibody before the sandwich can assemble, whereas two-step formats with an intervening wash step remove that excess antigen before detection antibody is ever added, making them substantially less vulnerable to the effect.
Picture the workflow as two lanes. In a one-step lane, sample, capture antibody, and detection antibody incubate together in a single well, then get washed once. In a two-step lane, sample meets capture antibody first, unbound antigen is washed away, and only then does detection antibody enter the well. That intermediate wash step is the critical design difference: it physically removes the excess antigen that would otherwise saturate the detection reagent, which is why two-step assays are the standard mitigation strategy in kit design.
The concentration at which hook actually kicks in is not fixed. It shifts with antibody affinity, reaction kinetics, and the binding capacity of the solid phase, so two kits measuring the same analyte can have meaningfully different hook thresholds even when both use a one-step format.
Pro Tip: When validating a new one-step kit, ask the manufacturer directly for the documented hook threshold and the antigen excess range tested during development. Few technical sheets volunteer this, but most manufacturers hold the data and will share it on request.
Which analytes and clinical scenarios are most at risk?
Some analytes are far more likely to produce clinically significant hook effect than others, largely because their pathological concentrations can climb to levels far beyond the assay’s intended working range.
-
β-hCG: molar pregnancies and certain germ cell tumours can push concentrations into the millions of mIU/mL, well past ordinary calibration ranges.
-
Prolactin: large prolactinomas are the textbook case, where a genuinely enormous prolactin level reads as normal or only mildly elevated.
-
Calcitonin: extensive medullary thyroid carcinoma can generate concentrations that trigger postzone suppression.
-
PSA: advanced, poorly differentiated prostate cancer occasionally produces PSA levels high enough to hook, ironically understating disease burden.
-
CA125: bulky ovarian malignancy or extensive peritoneal disease can drive concentrations into the hook zone.
-
Cryptococcal antigen: heavy fungal burden in disseminated cryptococcosis can hook lateral-flow and ELISA-based antigen tests alike.
-
Certain drug and toxicology screens: pooled urine or serum specimens with very high metabolite concentrations can screen falsely negative.
Two scenarios illustrate why this matters beyond the bench. A patient with a large, radiologically confirmed prolactinoma returns a prolactin result that sits within, or only just above, the normal reference range on a one-step assay; the tumour is real, but the number tells a reassuring lie until someone orders a dilution. In a second case, a pooled urine drug screen reports negative despite strong clinical suspicion of opioid use, and only a 1:100 dilution, later confirmed by LC-MS/MS, reveals an extremely high metabolite concentration that had been masking itself in the neat well.
For analytes with a known ceiling risk, such as prolactin, β-hCG, and calcitonin, many laboratories now build automatic reflex dilution into the protocol whenever a result sits near the assay’s upper reportable limit or fails to match the clinical picture, rather than waiting for a clinician to ask.
Step-by-step protocol to detect and confirm hook effect
Serial dilution remains the gold standard for detecting the hook effect, and it works because a genuine hook sample behaves in a very specific, reproducible way: the reading climbs rather than falls as you dilute it further.
Sample handling starts before you touch a dilution series. Confirm the specimen was collected and stored correctly, note any visible signs that might suggest an unusually concentrated matrix, and always dilute in the assay’s own recommended diluent rather than saline or water, which can introduce matrix effects of their own.
-
Prepare a dilution series, typically 1:10 and 1:100, using the manufacturer’s specified diluent.
-
Run the neat sample and both dilutions on the same plate, in the same run, to remove plate-to-plate and run-to-run variability from the comparison.
-
Include the kit’s standard high and low controls, plus, where available, a dedicated high-dose control material that sits above the top calibrator.
-
Compare neat versus diluted results directly: a diluted reading that exceeds the neat reading, once you account for the dilution factor, confirms hook.
-
If the first dilution result is still ambiguous, extend to a wider series, since some analytes need dilutions well beyond 1:10 before the true concentration reveals itself.
-
Calculate the reportable concentration by multiplying the diluted result by its dilution factor, and confirm that value sits within the assay’s validated linear range at that dilution.
-
Document the dilution factor, the plate ID, and the reagent lot used for the confirmatory run before releasing the result.
The table below sets out how this typically plays out across a standard three-point dilution series.
| Dilution | Typical use | Interpretation if hook suspected |
|---|---|---|
| Neat (undiluted) | Initial screening result | Low or “not detected” despite strong clinical suspicion |
| 1:10 | First confirmatory dilution | May still under-read for very high concentrations |
| 1:100 | Extended confirmatory dilution | Often reveals a markedly higher true concentration |
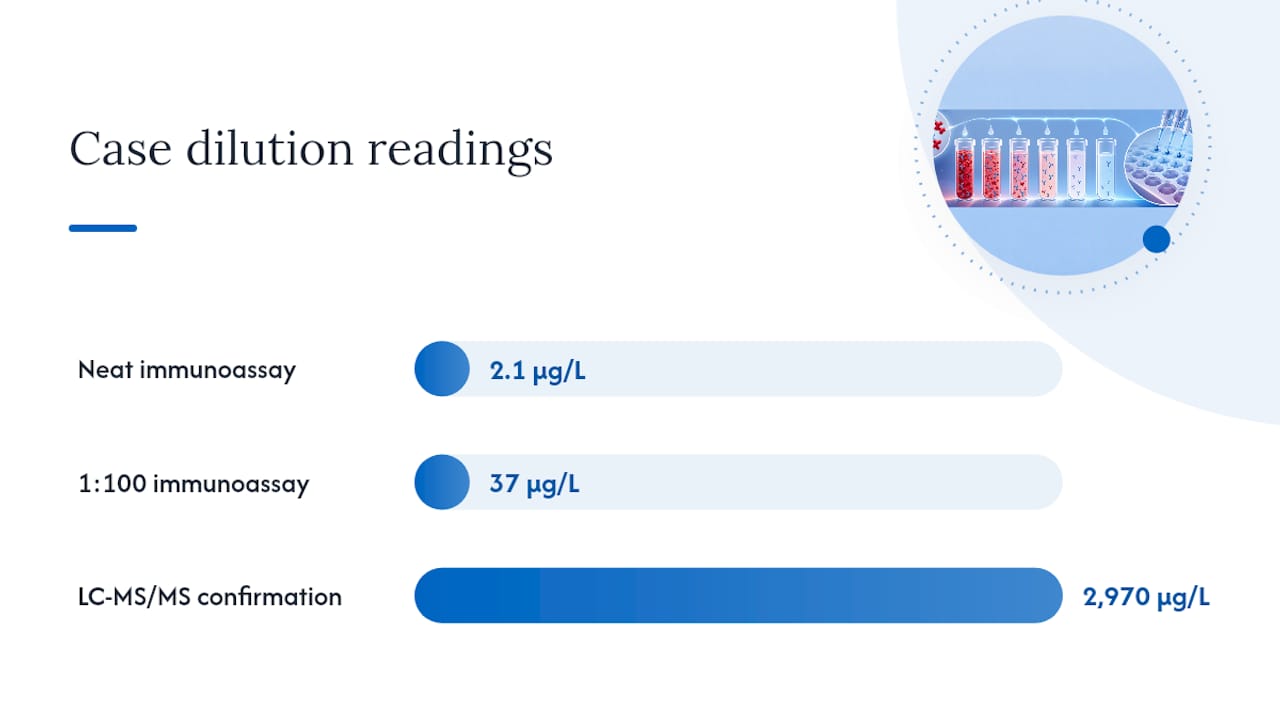
Published case data from pooled urine drug screening illustrates why a single 1:10 step is not always enough: a neat immunoassay reading of 2.1 μg/L, essentially “not detected,” rose to 37 μg/L at 1:100 dilution, while LC-MS/MS confirmation on the same specimen measured roughly 2,970 μg/L. A 1:10 dilution alone would have understated the true concentration by nearly two orders of magnitude.
The decision logic, once you have both results in hand, runs as a simple if-then chain. If the diluted result is higher than the neat result, confirm with at least one additional dilution point, then report the corrected value with an interpretive comment noting the hook effect. If the diluted result is lower than or proportional to the neat result, hook effect is unlikely, and other interference mechanisms, including heterophile antibodies or genuine cross-reactivity, become the more likely explanation, distinguished partly by how the result behaves on dilution and in spike-recovery testing.
A short list of what not to do matters just as much as the protocol itself. Do not assume a kit’s built-in controls will catch a high-dose hook sample; standard low and high controls are rarely calibrated to sit in the postzone region. Do not re-run only neat replicates when a result looks clinically implausible, since repeating the same dilution simply reproduces the same error. Do not release a result that contradicts strong clinical evidence without at least one dilution check first.
Pro Tip: Automated pooled screening protocols that routinely compare neat and 1:100 dilutions have exposed hidden hook samples in high-throughput toxicology and endocrinology workflows well before LC-MS/MS confirmation was even requested, turning a rare edge case into a catchable, routine event.
Preventing hook effect through assay design and validation
Detection matters, but the stronger long-term fix is designing and validating assays so the hook region sits far outside any concentration you would realistically encounter, or is at least clearly flagged when it does.
Several design changes reduce hook risk directly:
-
Favour two-step assay formats with an intermediate wash step wherever the analyte is known to reach very high pathological concentrations.
-
Increase capture antibody density using high-binding-capacity plates, which raises the antigen concentration needed before postzone suppression begins.
-
Adjust the ratio of capture to detection antibody so that detection antibody is not the limiting reagent in solution.
-
Use blocking agents appropriately to reduce non-specific binding that can compound interpretation once you are already troubleshooting a suspected hook.
Validation work should go beyond a standard calibration curve. Chessboard titration, testing multiple capture and detection antibody concentrations against each other in a grid, identifies the antibody ratio and solid-phase capacity that maximise dynamic range and push the hook threshold as high as practically achievable. Pair that with high-dose control materials spanning several orders of magnitude above the top calibrator, so the hook region is mapped rather than assumed, and run matrix spike-recovery experiments at those high concentrations to confirm the assay behaves predictably rather than silently failing.
A practical validation and policy sequence looks like this:
-
Run chessboard titration during method development to fix capture and detection antibody concentrations at their optimal ratio.
-
Extend the calibration curve, or at least a verification series, up to concentrations well beyond the expected clinical range to visualise where the hook region begins.
-
Set a reflex dilution threshold, a specific value or index near the assay’s upper reportable limit, above which automatic dilution and retesting are mandatory.
-
Build a high-dose challenge sample into routine internal quality control, run periodically rather than only at initial validation.
-
Document the analytical measurement range (AMR) boundaries clearly in the SOP, including where the hook region sits relative to that range.
None of this comes free. Chessboard titration, extended calibration verification, and routine high-dose QC challenges all add reagent cost and hands-on time, and a lab running high volumes of a low-risk analyte may reasonably decide that a pragmatic reflex dilution policy, triggered only by specific red flags, is a better use of resources than exhaustive upfront hook mapping. The right balance depends on analyte risk, sample volume, and how often clinical correlation actually surfaces a discrepancy.
How often does hook effect actually occur, and when should you suspect it?
Incidence varies considerably by analyte and by assay platform, so there is no single universal rate worth memorising. What is worth remembering is which situations should raise your suspicion immediately.
One study reported the hook effect in a non-trivial subset of patients with large prolactin-secreting macroadenomas, a meaningful minority in a population where the consequence of missing it, an unnecessarily conservative treatment decision, is significant. Rates for other analytes and platforms differ, sometimes considerably, which is exactly why a representative case series should inform your suspicion rather than a single quoted percentage.
Certain triggers should prompt hook testing regardless of the specific published incidence for that analyte:
-
A result that is unexpectedly low or merely “normal” despite strong clinical or radiological evidence of significant disease burden.
-
A large tumour mass on imaging paired with a marker result that seems disproportionately modest.
-
A very high index value or flag on an alternative platform or a repeat sample, suggesting the assay is straining near its upper limit.
-
A pooled screening result that reads negative but reverses to positive on a routine 1:100 dilution check.
The practical rule of thumb many labs adopt is straightforward: when a clinical decision, such as choosing surgery over medical management, would change based on the laboratory value, maintain a low threshold for reflex dilution rather than relying on a single neat measurement. That threshold should be lower, not higher, whenever the stakes of getting it wrong are high.
Writing SOP language and reporting comments for hook effect
A protocol only works if it is written into the SOP clearly enough that any technician on any shift follows it the same way, and the reporting language that follows it needs to be just as consistent.
Build the following into your SOP checklist:
-
Define specific reflex dilution triggers by analyte, whether that is a numerical threshold, an instrument flag, or a clinician request for correlation.
-
Specify documentation fields required for every reflex dilution: dilution factor used, reagent lot numbers, plate ID, and the operator who performed the confirmatory run.
-
Name who is authorised to sign off a hook-corrected result before release, and under what circumstances the ordering clinician must be notified directly rather than simply informed via the report.
-
Set a maximum turnaround time for confirmatory dilution testing so hook investigation does not silently stall a result.
Interpretive comments should be specific enough that the next clinician reading the report understands exactly what happened, without needing to ring the lab to ask. A workable template reads: “Result may be affected by high-dose hook effect on initial testing; value reported here reflects a 1:100 dilution, corrected for dilution factor.” Where hook was suspected but not confirmed, a softer comment noting that dilution testing was performed and returned a proportional result is equally useful documentation.
Beyond individual reports, build hook-related metrics into routine quality audits:
-
Track the frequency of reflex dilutions performed per analyte per month, to spot drift in either direction.
-
Record every episode where clinical correlation, rather than an automatic threshold, prompted a dilution check, along with the outcome.
-
Review these records periodically to decide whether reflex thresholds need adjusting for a specific analyte or platform.
How verified reagents and independent validation reduce hook-related errors
Reagent quality sits underneath every one of the protocols above, and it is easy to overlook. A hook threshold that looked robust in a manufacturer’s technical sheet can shift meaningfully if the antibody pair you actually receive differs in affinity or purity from the lot that generated that original data.
Matched antibody pairs with documented, verifiable provenance behave predictably at high antigen concentrations because their binding characteristics have actually been checked against each other, rather than assumed from a generic product description. Independent high-dose challenge testing, run before a reagent ever reaches routine use, is what tells you where that particular pair’s hook region actually sits, rather than where a data sheet claims it sits.
This is precisely the gap Abmium’s approach to reagent sourcing addresses. Its focus on verified antibody provenance, pre-purchase validation, and independent validation services gives laboratories a way to confirm an antibody pair’s real-world performance, including its high-dose behaviour, before committing budget and bench time to a full assay build. A detection system such as the polymer-HRP anti-mouse/rabbit IHC detection kit illustrates the kind of characterized, provenance-checked reagent this approach is built around.
Consider a lab that had been reporting prolactin results using a supplier’s default reflex threshold, set generically rather than for their specific kit lot. Independent validation testing across a wider concentration range revealed their actual hook onset sat noticeably lower than the manufacturer’s stated figure, prompting a revised, tighter reflex dilution policy and a measurable drop in the kind of false-reassuring result that had previously required after-the-fact correction. That kind of adjustment only happens when someone actually checks the reagent’s real behaviour rather than trusting the label.
A laboratory perspective on trusting the number in front of you
The lesson that repeats across years of routine testing is rarely subtle: the result that looks most reassuring is often the one worth checking hardest. A prolactin sitting comfortably in the normal range next to a scan showing an obvious macroadenoma is not a contradiction to explain away. It is a prompt to dilute and re-test, every time, before anyone signs the report.
What tends to get underestimated is how rarely the standard kit controls catch this. They validate the middle of the curve, not the postzone region, so a technician who trusts a passing QC run as proof the assay is behaving normally at any concentration is trusting the wrong thing. The habit worth building is smaller than a full protocol: whenever a result contradicts the clinical picture in front of you, dilute before you release, and never assume the assay’s internal controls have already checked that for you.
Getting hook-safe reagents and validation support from Abmium
Abmium supplies verified antibodies, matched pairs, and independent validation services built specifically to help laboratories confirm high-dose behaviour before a reagent goes anywhere near a routine assay, rather than discovering a hook problem after results are already in a patient file.
If you are developing or revalidating a sandwich ELISA for an analyte with known hook risk, whether that is prolactin, β-hCG, or a tumour marker with a wide clinical concentration range, pre-purchase validation reduces the chance of an assay failure surfacing only after it has affected real results. Abmium’s catalogue of antibodies and ELISA kits gives you access to reagents with documented provenance, and its independent validation service lets you request high-dose challenge testing on a specific antibody pair before you commit to a full assay build. For labs assembling a detection workflow from scratch, options such as the anti-mouse IgG secondary antibody are a starting point worth checking against your own chessboard titration data. Visit Abmium to request validation support for your next assay development project.