

Lot to lot variability is a measurable shift in analytical performance between manufacturing batches of the same reagent or calibrator, and it can move patient results across a clinical decision threshold without any warning from routine internal quality control. The immediate action for any laboratory receiving a new lot is straightforward: verify it against the outgoing lot using samples that reflect real patient specimens, then keep monitoring afterwards rather than treating verification as a one-off event.
TL;DR:
- Most lot to lot variability in reagents stems from raw materials, which contribute around 70% of performance differences, especially in immunoassays.
- Lot changes can cause clinical result shifts that cross diagnostic thresholds without detection by routine quality control, risking misdiagnosis or improper treatment adjustments.
- Verification protocols should focus on high-risk assays used for treatment decisions, with sample sizes tailored to assay volume and clinical stakes, and should include patient sample testing.
- Continuous patient result monitoring, like moving averages, helps detect slow, cumulative drift between lots that point-in-time verifications may miss.
- Suppliers providing detailed batch documentation and pre‑purchase validation reduce verification workload and improve lot traceability for more reliable results.
Table of Contents
- What causes lot to lot variability in reagents and calibrators
- Clinical and experimental consequences of lot changes
- When should a laboratory perform lot verification?
- Why routine QC and EQA can miss lot to lot variability
- CLSI EP26 versus pragmatic in house verification protocols
- Setting defensible acceptance criteria for lot verification
- Running a lot verification study: sample selection and analysis
- Catching cumulative drift with ongoing monitoring
- What to do when a lot verification study fails
- Where verified reagent sourcing reduces the verification burden
- A 30 day action plan for reducing lot to lot risk
- Verified reagents and independent validation, without the guesswork
- Core standards and reviews worth keeping on file
- Sources
- FAQ
What causes lot to lot variability in reagents and calibrators
Variability between reagent lots rarely comes from a single fault. It builds up across the supply chain, from raw material sourcing through to the moment a technologist loads a new box onto the analyser.
Raw materials are the dominant contributor. In immunoassays specifically, reviews estimate that raw materials account for roughly 70% of performance variability, with manufacturing processes responsible for the remaining share. Antibody clones can drift subtly between purification runs, calibrator matrices can vary in protein content, and biological reagents sourced from animal or human material carry inherent batch to batch heterogeneity that synthetic chemicals do not.

Manufacturing and formulation changes compound the problem. A manufacturer might adjust a buffer concentration, switch a stabiliser, or alter a conjugation ratio for reasons unrelated to clinical performance, such as cost or supply continuity, yet still shift the assay’s calibration curve. These changes are often undisclosed to laboratories unless they read package insert revisions carefully.
Storage, transport and handling add a further layer. Temperature excursions during shipping, freeze thaw cycles before first use, and even how long a reagent sits on an analyser once opened can all alter reactivity. A lot that performed well in the manufacturer’s own validation can still degrade differently to its predecessor once it has travelled through a real world cold chain.
Assay design and human factors round out the picture. Sandwich immunoassays with narrow antibody affinity windows are more sensitive to raw material shifts than robust colourimetric chemistries. Operator technique, pipetting precision, and instrument maintenance schedules interact with reagent lot changes in ways that are difficult to separate from the reagent itself.
Assays commonly flagged as sensitive to lot to lot variability include:
- Cardiac troponin assays, where small shifts near the 99th percentile cut off affect myocardial infarction rule out decisions
- Thyroid stimulating hormone assays, where narrow reference intervals leave little room for bias
- Tumour marker assays such as PSA and CA 125, where trend monitoring over time is clinically meaningful
- Coagulation reagents, particularly those used for prothrombin time and international normalised ratio reporting
- Therapeutic drug monitoring assays, where dosing decisions depend on precise absolute values
Understanding which of these mechanisms is at play helps a laboratory decide whether to query the manufacturer, tighten internal handling procedures, or simply increase monitoring intensity for a particular test.
Clinical and experimental consequences of lot changes
A shift in bias or precision after a lot of change does not stay confined to a quality control chart. It moves into patient reports, and if the shift crosses a clinical decision threshold, it can change a diagnosis or a treatment decision.
The distinction between a QC only shift and a patient result shift matters enormously in practice. Quality control materials are manufactured, stabilised, and often lyophilised in ways that patient serum is not. A reagent lot can pass QC comfortably while still producing a small, consistent bias in real patient specimens, a phenomenon rooted in the concept of commutability discussed further below. Lot to lot variation is recognised as a significant source of analytical error precisely because it can evade the very systems designed to catch it.
Statistic callout: Immunoassay reviews attribute approximately 70% of lot to lot performance variability to raw materials rather than manufacturing process changes, which is why reagent provenance tracking and antibody sourcing history matter as much as post production QC.
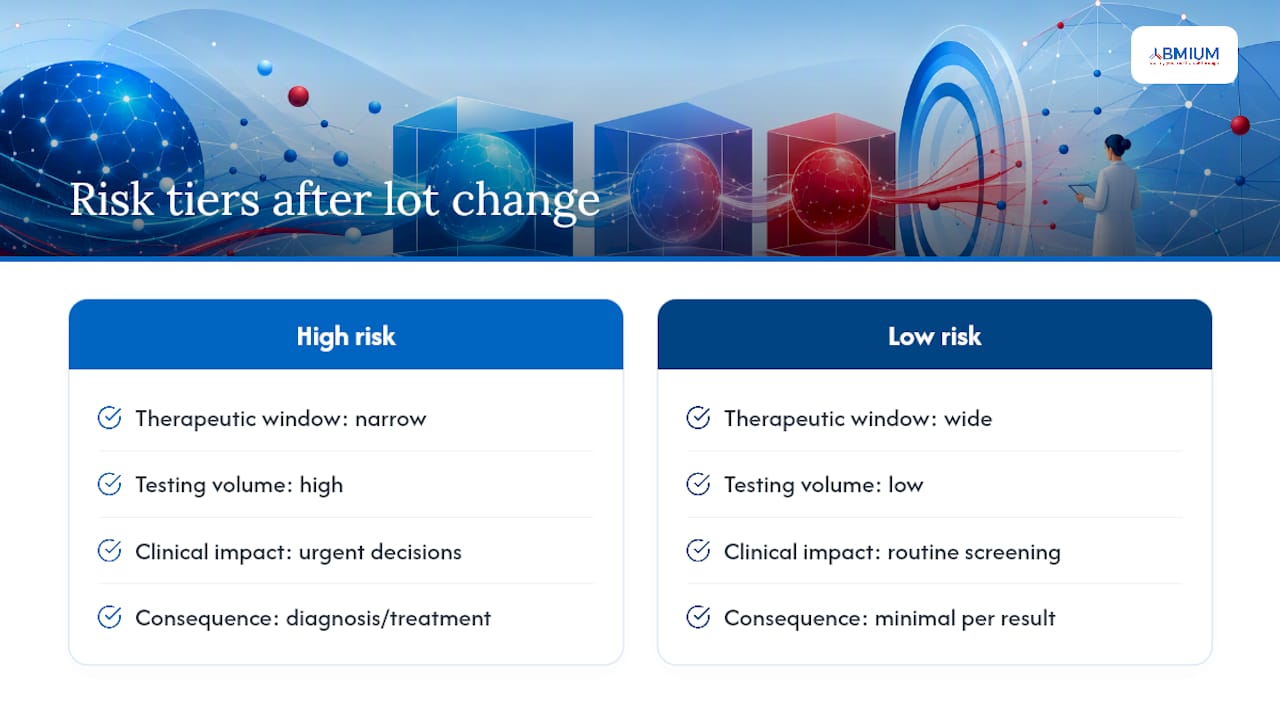
Risk categorisation gives laboratories a practical way to prioritise attention. Assays with narrow therapeutic or diagnostic windows, high testing volume, or direct influence on urgent clinical decisions sit in a high risk tier. Assays used mainly for general screening, with wide reference intervals and low clinical stakes per result, sit lower. A troponin assay used to rule in or rule out acute coronary syndrome carries a fundamentally different consequence profile to a routine lipid panel, even though both could show the same numerical percentage shift after a lot of change.
Published cases in the literature describe lot changes that altered classification near a cut off, for example shifting a proportion of results from below to above a diagnostic threshold without any change in the patient’s actual physiology. These are the scenarios that acceptance criteria are designed to prevent, not the broad average shifts that IQC typically flags.
When should a laboratory perform lot verification?
ISO 15189 sets out an expectation that laboratories verify performance claims before introducing new reagent lots into clinical use, but the standard does not prescribe a single protocol for every test. That leaves the depth of verification to the laboratory’s own risk judgement, which needs to be pragmatic given finite staff time and sample availability.
A workable triage approach separates assays into three tiers rather than treating every lot change identically:
- Always verify fully: cardiac markers, coagulation reagents, therapeutic drug monitoring, and any assay directly tied to a treatment or admission decision
- Verify with a reduced protocol: routine chemistry and haematology analytes with wide reference intervals and low immediate clinical stakes
- Verify opportunistically: low volume specialist assays where full verification each lot would consume a disproportionate share of sample and staff time, but where cumulative monitoring still applies
Resource constraints are real, and pretending otherwise leads to verification programmes that exist on paper but are not sustained in practice. A small laboratory running a handful of specialist immunoassays cannot apply the same sample numbers as a high throughput core laboratory, so the tiering above should flex according to testing volume, staffing, and the clinical weight carried by each result. CAP checklist item COM.30450 addresses this expectation directly, requiring documented evidence that new lots have been evaluated before use, which is a useful internal reference point even for laboratories not undergoing CAP accreditation.
Why routine QC and EQA can miss lot to lot variability
Internal quality control and external quality assessment are essential, but neither was designed specifically to detect lot to lot shifts in patient samples, and both have a structural blind spot called commutability.
Commutability describes whether a control or EQA material behaves in an assay the same way a real patient specimen does. Many QC materials are stabilised, spiked, or lyophilised, which changes their matrix relative to fresh serum or plasma. A reagent lot can therefore produce QC results that sit perfectly within range while patient samples run on the same lot show a genuine shift, because the QC material simply does not react to the new lot’s raw material change the way a patient specimen would.
EQA carries a related limitation, that of timing and frequency. Most EQA schemes distribute samples only a few times per year, which means a lot introduced between rounds can operate unchecked by external assessment for months. By the time the next EQA cycle flags an issue, if it flags one at all given the same commutability concern applies, a laboratory may have reported thousands of results on an affected lot.
Pro Tip: Run a small panel of leftover, de‑identified patient samples spanning low, mid and high concentrations alongside your QC material at every lot change. Patient samples reveal commutability problems that manufactured QC material structurally cannot.
The practical alternative is not to abandon QC and EQA, but to treat them as necessary rather than sufficient. Supplementing them with patient sample comparisons at the point of lot change, and with the continuous monitoring approaches covered later in this article, closes the gap that commutability creates.
CLSI EP26 versus pragmatic in house verification protocols
CLSI EP26 is the closest thing the industry has to a standardised statistical method for lot verification, and understanding its logic helps even laboratories that cannot follow it to the letter.
EP26 works through a defined sequence:
- Define a critical difference (CD), the smallest change between lots that would be considered clinically or analytically meaningful for that specific assay
- Select a statistical power, typically balancing the risk of false acceptance against the burden of unnecessary rejection
- Calculate a rejection limit derived from the critical difference and chosen power, which becomes the pass or fail threshold for the verification study
- Determine sample size using EP26’s lookup tables, which link the number of patient samples needed to the chosen CD and power
- Run the study across the calculated sample number, comparing old and new lot results on the same specimens
- Compare the observed difference to the rejection limit and accept or reject the new lot accordingly
The strength of EP26 lies in its statistical honesty. It forces a laboratory to state, in advance, what difference actually matters clinically rather than reacting after the fact to whatever number appears. The weakness, acknowledged even within the standard’s own supporting literature, is that EP26 can demand large sample sizes and specialised calculations that are impractical for many routine laboratories, particularly for lower volume specialist assays where sourcing enough fresh patient samples across the required concentration range within a reasonable timeframe is genuinely difficult.
This is where pragmatic in house protocols earn their place. Practical guidance published in laboratory medicine literature describes laboratories using variable numbers of patient samples depending on the assay and the statistical power they are willing to accept, rather than the larger counts EP26’s tables sometimes suggest. The trade-off is a documented, locally justified statistical rationale rather than full adherence to EP26’s formal framework. A small laboratory might reasonably use six samples spanning low, mid and high concentrations, each run in duplicate, and accept a lower statistical power than EP26’s default, provided that choice is written into a validated procedure rather than made informally each time.
Statistical software such as MedCalc is commonly cited in the literature for handling the regression and difference calculations these protocols require, since manual calculation of confidence intervals across multiple concentrations quickly becomes impractical by hand. Whichever tool is used, the principle that matters is documenting the chosen critical difference and power before the study runs, not after seeing the data.
Setting defensible acceptance criteria for lot verification
Acceptance criteria only mean something if they are tied to what actually matters for patient care, rather than an arbitrary round number like “within 10%” chosen because it looks tidy on a validation form.
Total allowable error, or TEa, gives laboratories a benchmark rooted in how much analytical error a test can tolerate before it risks misclassifying a patient. Milan criteria extend this thinking by linking acceptable performance limits to biological variation data, the natural fluctuation of an analyte within and between healthy individuals, rather than to a manufacturer’s marketing claim or a historically inherited tolerance.
Practical guidance for choosing acceptance criteria includes:
- Start from the clinical decision point the assay serves, such as a diagnostic cut off or a treatment threshold, and work backwards to the maximum tolerable bias at that specific concentration
- Reference published biological variation data where available, since Milan criteria based limits are generally tighter and more defensible than percentage based rules of thumb
- Set statistical power deliberately rather than by default, understanding that higher power reduces the risk of false acceptance but increases the sample size and effort required
- Document the rationale behind each criterion in the same procedure that describes the verification protocol, so the link between medical need and the numerical threshold is auditable
- Revisit criteria periodically, since biological variation databases and consensus documents are updated as more data becomes available
A criterion built this way survives scrutiny during accreditation review, because it answers the question an assessor will actually ask: why does this number matter for the patient, not just where did this number come from.
Running a lot verification study: sample selection and analysis
Sample choice determines whether a verification study actually detects the shift it was designed to catch, and this is where many otherwise well-intentioned protocols quietly fail.
Fresh patient samples beat manufactured QC or EQA material for the commutability reasons already covered. Wherever possible, use leftover, de‑identified clinical specimens rather than spiked or reconstituted material, and select them to span the concentration range that matters clinically, not simply whatever happens to be available that morning.
A workable process runs in this order:
- Identify decision critical concentrations for the assay, typically near diagnostic cut offs or treatment thresholds, and ensure samples cover low, mid and high points across that range
- Determine sample numbers appropriate to laboratory size, using EP26’s Appendix A tables as a starting reference where feasible, or a documented reduced count for smaller laboratories
- Run each sample in duplicate or triplicate on both the outgoing and incoming lot, ideally within the same analytical run to minimise unrelated sources of variation
- Calculate mean difference, percentage bias at each concentration, and regression statistics including slope, intercept and r² across the concentration range
- Compare percentage bias at each concentration against the TEa or Milan criteria based limit established for that assay, not against a single blanket tolerance
- Record the full dataset, calculations and pass or fail decision in a format suitable for accreditation review, including the specific lot numbers involved
Statistic callout: Documented practice in laboratory medicine literature describes verification studies using as few as one to twenty patient samples depending on assay type and the statistical power a laboratory chooses to accept, which shows that a rigorous study does not always require EP26’s larger default sample counts.
Traceability matters as much as the maths. Recording manufacturer communications, release testing certificates and batch documentation alongside the verification data gives assessors a complete audit trail and speeds up any later investigation if a problem emerges downstream. A calibrated reference material with clear batch documentation, such as a calibrated protein marker with defined molecular weight ranges, also gives a verification study a stable reference point when comparing lots.
Catching cumulative drift with ongoing monitoring
Discrete lot verification catches a sudden step change, but it is structurally blind to slow, cumulative drift that builds across several consecutive lots, each individually within acceptance limits. This is where continuous monitoring earns its place alongside, not instead of, point in time verification.
Moving averages and patient based quality control work by tracking the running mean of real patient results over time, independent of any single lot change. A gradual upward creep across three or four lots, invisible to any single verification study, becomes visible once plotted as a trend line. Patient based QC and moving averages are recommended specifically because they detect the kind of creeping bias that discrete lot checks are not designed to catch.
Implementation comes down to a few practical parameters:
- Choose a rolling window sized to daily testing volume, large enough to stabilise the mean but small enough to respond to a genuine shift within a reasonable timeframe
- Set exclusion rules that remove obvious outliers, such as results from grossly haemolysed or clotted samples, before they distort the moving average
- Define alert thresholds in advance, ideally linked to the same TEa or biological variation limits used for lot verification, rather than reacting subjectively to a chart that looks unusual
- For low throughput assays, consider weekly aggregates or sentinel samples run at fixed intervals rather than a true daily moving average, since low volume data is too sparse to stabilise a short window
Sharing moving average data between laboratories running the same assay and lot, where professional networks or manufacturer forums allow it, accelerates detection considerably. A shift that looks like statistical noise in one laboratory’s dataset can become an obvious signal once several sites compare notes on the same lot number.
What to do when a lot verification study fails
A failed verification is not a crisis if the laboratory has a defined response ready in advance. It becomes a crisis only when the response is improvised under pressure while patient samples are already queuing on the analyser.
The first step is to rule out a false rejection before assuming the lot itself is faulty. Repeat the study, ideally expanding the sample number or adding a concentration point, since a single failed comparison can sometimes reflect a run specific issue such as a calibration error or a mishandled specimen rather than a genuine lot problem.
If the failure holds up on repeat testing, follow this sequence:
- Quarantine the affected lot immediately, halting its use for reportable patient results while the investigation continues
- Revert to the prior lot if stock remains available, or arrange referral testing at another laboratory for urgent samples in the interim
- Contact the manufacturer with a specific, documented data request, including the exact rejection limit exceeded, the concentrations tested, and the lot numbers involved, rather than a general complaint
- Document every manufacturer interaction and response as part of the accreditation record, since this documentation is essential evidence during audit and speeds resolution if the issue recurs
- Consider a validated corrective factor only if statistically justified and formally approved, never as an informal workaround, since an unvalidated correction introduces its own error into every subsequent result
Collaboration between manufacturers, regulators and laboratories is repeatedly identified in the literature as the most effective long term route to reducing lot to lot problems, which is a reminder that a single failed verification is often more useful to the manufacturer’s own quality system than laboratories realise, provided it is reported with clear data rather than left undocumented.
Where verified reagent sourcing reduces the verification burden
Much of the verification workload described above exists because laboratories often have limited visibility into how a reagent lot was actually produced, tested and shipped before it reached them. ABMIUM addresses that gap directly through verified antibody sourcing and pre‑purchase validation, giving laboratories provenance information before a purchasing decision is made rather than discovering problems after a lot is already in use.
Independent validation services add a further layer, since a laboratory does not always need to run a full internal verification study from scratch when independent performance data is already available for a specific batch. This matters most for the raw material variability discussed earlier, since reagent provenance tracking addresses the largest single source of lot to lot variability in immunoassays rather than the smaller manufacturing process contribution.
Pro Tip: Ask any reagent supplier for batch specific certificates of analysis before committing to a large order. A supplier that can produce this documentation readily is telling you something about how seriously it tracks provenance internally.
A 30 day action plan for reducing lot to lot risk
Start by triaging your test menu into the three risk tiers described earlier, and confirm which assays currently have no documented lot verification procedure at all. That gap is more common than most laboratories admit.
Within the first month, implement patient based moving average monitoring for two of your highest risk assays, even if full rollout across the entire menu takes longer. Standardise acceptance criteria against TEa or Milan criteria rather than inherited percentage rules, and write the rationale into your procedure. The most common pitfall is treating verification as a checkbox exercise completed once per lot and then forgotten. Where internal resources or antibody sourcing history are limited, independent validation support closes that gap faster than building the capability from scratch.
— Veron
Verified reagents and independent validation, without the guesswork
ABMIUM is the sourcing route for laboratories that want documented provenance before money changes hands, not after a problem surfaces on the bench. Where a general distributor hands you a product and a certificate of analysis you have to take on faith, ABMIUM supplies pre‑purchase validation data and batch provenance review upfront, so the groundwork this article describes has already partly been done before your own verification study begins.

Laboratories that need a reliable secondary antibody with clear batch documentation can start with the Anti-Mouse IgG Antibody Poly1440, or browse calibrated reference materials such as the calibrated colour prestained protein marker for use as a stable comparator during lot verification work. For primary antibodies with detailed sourcing records, the Anti-SA Antibody 15E6 illustrates the depth of documentation ABMIUM provides on every product page. If your laboratory needs independent validation on a reagent already in use, or wants provenance data ahead of an institutional purchasing decision, request that information directly through the ABMIUM catalogue before your next order goes out.
Core standards and reviews worth keeping on file
CLSI EP26 remains the reference protocol for statistically grounded lot verification, and its critique of practical limitations is as useful as its methodology. ISO 15189 sets the accreditation expectation that acceptance testing happens before clinical use, while CAP checklist item COM.30450 gives a concrete documentation standard to work against. For evidence on causes and consequences specifically within immunoassays, the peer reviewed review on immunoassay LTLV and the practical verification guide both offer workable detail beyond what any single standard covers.
This article is general information, not a substitute for advice from a qualified doctor. Consult a qualified healthcare professional about your own circumstances before acting on anything here.
Sources
- Lot‑to‑Lot variance in immunoassays—causes, consequences, and solutions
- Lot to Lot reagent verification: A practical guide on how to do it?
- Lot-to-lot variation and verification
FAQ
What are the five pre‑analytical errors linked to lot changes?
Common pre‑analytical errors include specimen mislabelling, inadequate sample volume, incorrect storage temperature, delayed transport to the laboratory, and haemolysis, all of which can compound or be mistaken for a genuine lot to lot shift if not controlled during a verification study.
How do you actually perform lot to lot verification?
Select fresh patient samples spanning low, mid and high clinically relevant concentrations, run them in duplicate on both the outgoing and incoming lot, and compare the percentage bias at each concentration against a predefined acceptance limit based on TEa or Milan criteria, following either CLSI EP26 or a documented in house protocol.
What are the seven clinical analysis areas of the laboratory?
Clinical laboratories are typically organised into clinical chemistry, haematology, immunology and serology, microbiology, blood banking and transfusion medicine, molecular diagnostics, and coagulation, each with different sensitivity to lot to lot variability depending on assay design and reagent complexity.
How much lot to lot variability is acceptable?
Acceptable variability depends on the assay and its clinical decision point rather than a single universal figure; it is generally defined using total allowable error or biological variation based limits, such as Milan criteria, calculated for that specific analyte and concentration.
Can routine quality control alone detect lot to lot variability?
Not reliably. Quality control materials often lack commutability with real patient samples, meaning a lot can pass QC comfortably while patient results shift, which is why patient sample comparisons and ongoing patient based monitoring are recommended alongside routine QC.