

Assay development is the process of producing a fit-for-purpose, reproducible measurement system that supports decision making in research and drug discovery. Done properly, it delivers a documented assay, complete with SOP and validation data, ready for screening or regulatory scrutiny. Standards such as ICH Q2(R2) and resources like ABMIUM for reagent provenance make that outcome achievable rather than aspirational.
TL;DR:
- Assay development is typically triggered by novel targets lacking validated reagents, complex sample matrices, or repurposing existing kits for unvalidated applications.
- Validated reagents must have documented provenance, application validation, and lot-specific performance data to prevent failures due to reagent variability.
- Applying Quality by Design and Design of Experiments early in development reduces failure risk during scale-up and improves assay robustness across conditions.
- Validation metrics like Z’-factor above 0.4 and documented specificity, accuracy, and robustness are essential to ensure assay reliability for screening purposes.
- Building comprehensive documentation, including SOPs, validation reports, and reagent provenance, streamlines transfer between sites and supports regulatory submission.
Table of Contents
- When do you need bespoke assay development, and which assay type fits?
- Assay development lifecycle: a stepwise checklist from purpose to SOP
- Design and optimisation: using Quality by Design to find the design space
- Validation and performance metrics: what to record and what to aim for
- Reagents, controls, and assay provenance: getting the raw materials right
- Scaling and automation: what changes when you move to HTS
- Common pitfalls, artefacts, and a troubleshooting checklist
- Detailed protocols for sensitivity, specificity, and robustness testing
- Data analysis techniques and software tools for assay evaluation
- Case studies: how optimisation choices played out in drug discovery
- Regulatory considerations and documentation for assay development
- Assay transfer and inter-laboratory reproducibility strategies
- Author perspective: what QbD and reagent provenance actually change
- How ABMIUM supports assay development from reagent to validation
- Essential standards and manuals to consult
- Sources
- FAQ
When do you need bespoke assay development, and which assay type fits?
Three triggers usually push a project from “buy a kit” to bespoke assay development: a novel target with no validated commercial reagent, an unusual sample matrix that breaks standard protocols, or repurposing an existing kit for an application it was never validated against. If none of these apply, a commercial kit with documented validation data may already meet your needs.
Once you have decided to build your own, the assay class follows the biology and the question you are asking.
- Biochemical assays measure isolated molecular interactions, such as enzyme kinetics or ligand binding, and typically give the cleanest, most reproducible readouts (absorbance, fluorescence, luminescence).
- Cell-based assays capture pathway activity or receptor signalling in a living system, reporting through reporter genes, viability dyes, or high-content imaging.
- Phenotypic assays screen for a functional outcome without a defined molecular target, useful in early discovery when the mechanism is still unknown.
Biochemical formats suit early-stage target validation and high-throughput hit finding. Cell-based and phenotypic formats come into play once you need physiological relevance, at the cost of higher variability and longer turnaround.
Assay development lifecycle: a stepwise checklist from purpose to SOP
Every robust assay follows a recognisable sequence, regardless of whether it runs on a bench or a liquid-handling robot. The assay development overview from NCBI Bookshelf frames this as defining purpose, selecting reagents, optimising sensitivity and dynamic range, automating where appropriate, and validating statistically.
- Define the analytical requirement. Set fit-for-purpose criteria: what decision will this assay support, and what precision does that decision demand?
- Select reagents and controls. Choose antibodies, standards, and positive/negative controls with documented provenance, not just a datasheet promise.
- Run initial optimisation. Test concentrations, incubation times, and buffer conditions against draft acceptance criteria, iterating until performance stabilises.
- Formalise the SOP. Write the standard operating procedure and validation protocol before verification begins, so every subsequent run is comparable.
Skipping step four is the most common shortcut, and it is the one that causes the most rework later. A documented SOP for immunochemical validation gives you a template to follow rather than reinventing the wheel each time.
Design and optimisation: using Quality by Design to find the design space
Optimisation by trial and error, changing one factor at a time, wastes reagent and calendar time without ever mapping how factors interact. Quality by Design (QbD) replaces that with a structured approach: define your critical quality attributes (CQAs), the outputs that matter (signal window, background, reproducibility), and your critical process parameters (CPPs), the inputs you control (reagent concentration, pH, incubation time, temperature). QbD applied to preclinical in vitro assay development shows that mapping CQAs against CPPs through Design of Experiments (DoE) reduces the likelihood of failure during scale-up or screening.
A practical DoE checklist looks like this:
- Screen factors first with a fractional factorial design to identify which CPPs actually matter.
- Follow with a response surface design (central composite or Box-Behnken) on the significant factors.
- Set your operational design space at the region where response surfaces show acceptable output across the expected range of input variation, not just at a single optimum point.
Pro Tip: Run your screening design before you order enough reagent for the full optimisation campaign. Half the factors you assumed mattered usually turn out not to.
Applying QbD early, rather than after a failed validation, is what separates an assay that survives technology transfer from one that needs rebuilding.
Validation and performance metrics: what to record and what to aim for
Validation is where an assay earns the right to be trusted. ICH Q2(R2) requires evaluation of specificity, accuracy, precision, and robustness for any assay supporting a new drug entity, with partial or cross-validation acceptable for minor method changes. Eurachem’s method validation guidance frames the same exercise as defining your analytical requirement first, then documenting performance against it, whether through single-lab or interlaboratory studies.
Record these characteristics as a minimum:
- Specificity: does the assay respond only to the intended analyte, not cross-reactive species?
- Accuracy and precision: how close to true value, and how repeatable across runs and operators?
- LOD/LOQ and linearity: the lower detection limit and the range across which response stays proportional.
- Robustness: how much does performance degrade under small, deliberate deviations from protocol?
For screening assays specifically, three statistics tell you whether the assay is fit for purpose. Z’-factor above 0.4 is the minimum acceptable threshold, with above 0.6 preferred for HTS. SSMD (strictly standardised mean difference) offers a more statistically robust alternative when sample sizes are small.
Reagents, controls, and assay provenance: getting the raw materials right
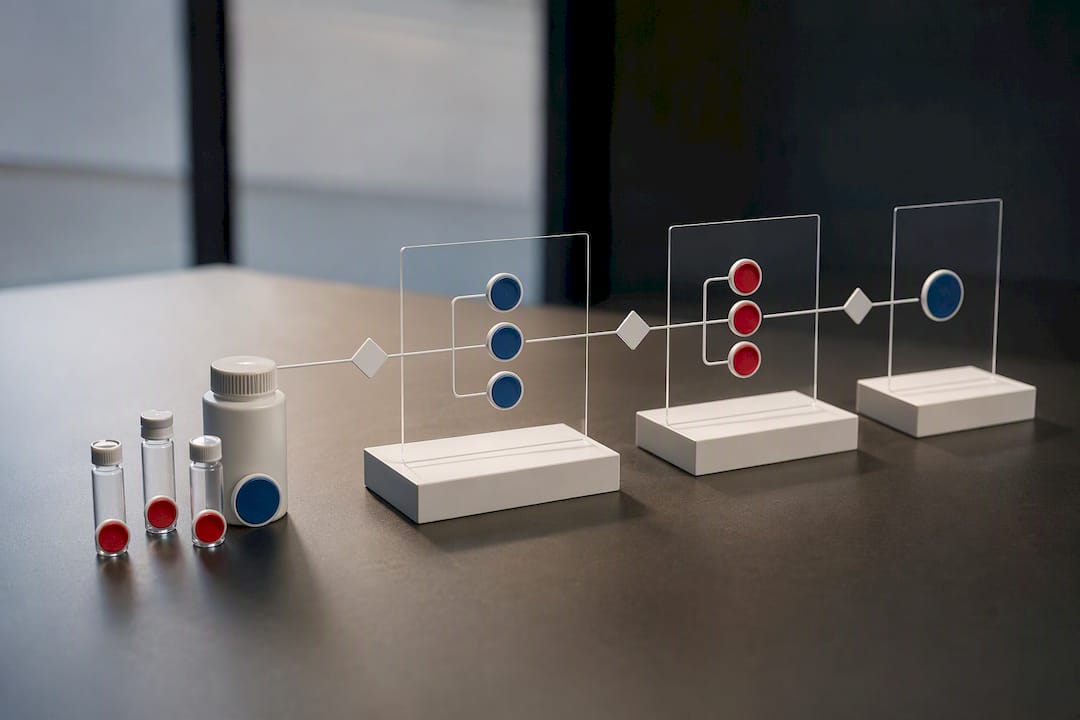
Most assay failures trace back to a reagent, not the protocol. Before committing to an antibody, demand documented application validation for your exact use (ELISA, IHC, western blot), confirmed species reactivity, clonality (monoclonal versus polyclonal), and lot-specific performance data rather than a generic datasheet claim.
Controls matter just as much as the primary reagent:
- Positive controls confirm the assay can detect a true signal on the day it runs.
- Negative controls rule out background and non-specific binding.
- Spike-and-recovery controls quantify matrix interference in complex samples.
- Matrix-matched controls mimic the real sample type, not a simplified buffer.
Document every reagent’s lot number, supplier, and validation reference in the lab notebook and reference it in the SOP, so a failed run can be traced to a specific batch rather than guessed at. This is precisely the gap ABMIUM addresses through pre-purchase validation and transparent provenance review on products like the Anti-SA Antibody [15E6], where application data and lot history are available before you buy rather than after a failed experiment.
Pro Tip: Ask any antibody supplier for the specific lot’s validation data, not the product-page average. Lot-to-lot drift is the single most under-diagnosed cause of assay drift.
Scaling and automation: what changes when you move to HTS
Moving from bench-scale to high-throughput screening changes more than the number of plates you run. HTS platforms typically process a large number of compounds per day, enabling rapid screening throughput, which means liquid-handling precision, plate uniformity, and daily system suitability checks become as important as the biology itself.
Practical considerations when scaling:
- Miniaturisation (384 well to 1536 well) reduces reagent cost but amplifies pipetting error and evaporation effects.
- Plate edge effects from temperature or evaporation gradients need daily monitoring, not a one-off qualification.
- System suitability controls on every plate catch drift before it corrupts a full run.
- Plate-level normalisation in your data pipeline corrects for systematic bias between plates and days.
None of this replaces the assay biology you validated at bench scale. It simply demands that the same rigour survives the transition to automation.
Common pitfalls, artefacts, and a troubleshooting checklist
Most assay failures fall into a handful of recognisable categories: compound interference (fluorescence or absorbance from the test compound itself), solvent artefacts (DMSO concentration effects), and matrix effects from the sample background. The Assay Guidance Manual treats assay development as continuous improvement, starting from fit-for-purpose goals rather than chasing a universal, over-engineered method.
When performance drifts, work through this sequence:
- Check control well performance first. Drift here points to reagent or operator issues before you suspect the biology.
- Inspect for plate position effects (edge wells versus centre) across recent runs.
- Verify reagent expiry dates and storage conditions against the SOP.
- Compare operator-to-operator variability if multiple people run the assay.
- If none of these resolve it, run a small DoE or consult a statistician rather than guessing at fixes one at a time.
Pro Tip: Include an orthogonal secondary assay or counter-screen early, not after your first screening campaign. It is far cheaper to catch compound-related interference before you commit to thousands of wells.
Detailed protocols for sensitivity, specificity, and robustness testing
Sensitivity testing establishes your limit of detection (LOD) and limit of quantification (LOQ) by running a dilution series of a known standard, typically eight to ten points spanning several orders of magnitude, then plotting the response curve to find where signal reliably separates from background noise. Run this in triplicate at minimum; a single dilution series tells you nothing about day-to-day reproducibility.
Specificity testing challenges the assay with structurally related molecules or cross-reactive species that could plausibly interfere. For an antibody-based assay, this means testing against paralogous proteins or species orthologues the assay is not intended to detect, and confirming the signal stays at background level. Document every cross-reactant tested, including the ones that showed no signal, since a validation report with only positive findings is incomplete.
The SOP-based approach to immunochemical method validation recommends building this into a formal protocol template rather than testing ad hoc, since robustness data collected without a fixed structure is hard to compare across method versions.
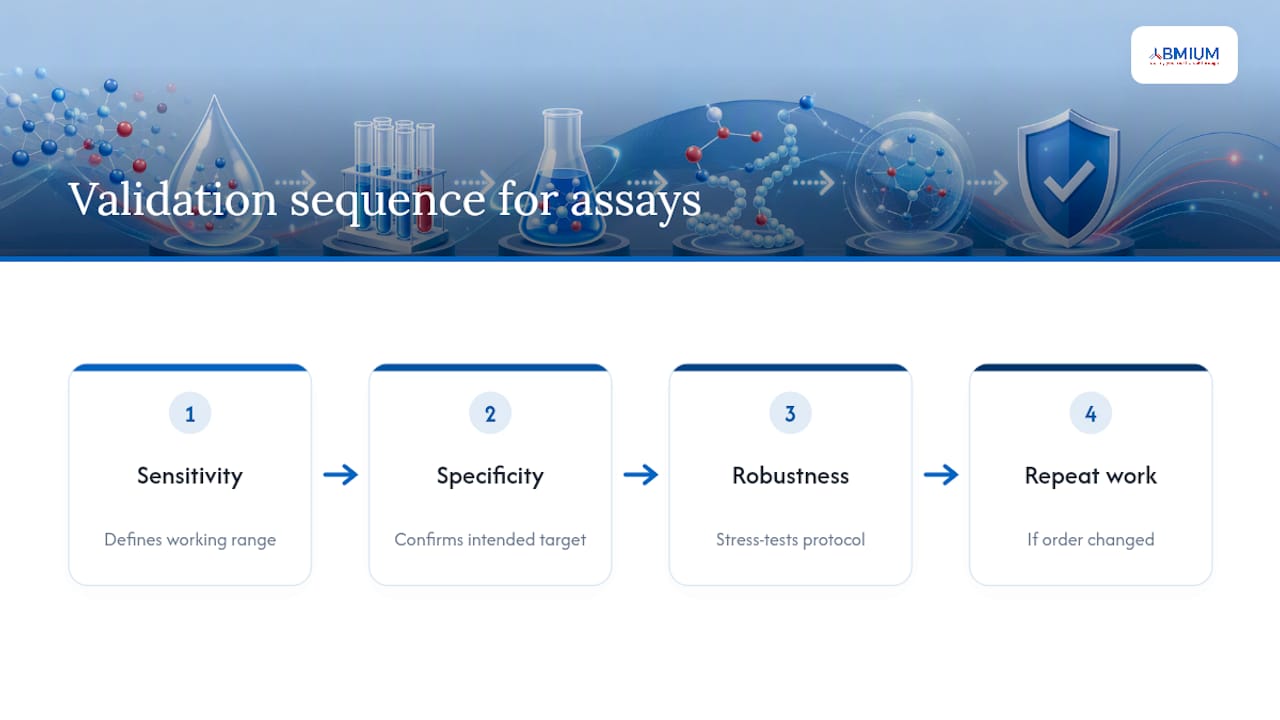
A practical sequence runs sensitivity first (it defines your working range), specificity second (it confirms you are measuring the right thing within that range), and robustness last (it stress-tests the protocol you have already shown works). Running them out of order usually means repeating earlier steps once a robustness failure reveals a hidden sensitivity problem.
Data analysis techniques and software tools for assay evaluation
Raw plate reader output rarely tells you anything on its own. The first analytical step is normalisation, converting raw signal to percentage of control or percentage inhibition, which corrects for day-to-day and plate-to-plate variation in absolute signal.
From there, dose-response curves fitted with a four-parameter logistic model give you EC50 or IC50 values, along with the Hill slope, which flags unusual binding behaviour worth investigating before you trust the potency number. Most laboratories use GraphPad Prism or R (with packages such as drc) for this curve fitting, alongside instrument-native software from plate reader manufacturers for initial data capture.
Statistical process control charts, tracking Z’-factor, %CV, and control well signal across successive runs, catch drift before it becomes a validation failure. Plotting these metrics over time, rather than checking them only at validation, turns troubleshooting from reactive to preventive.
For high-throughput datasets, software that flags outlier wells automatically, rather than relying on visual inspection of heatmaps, becomes essential once you are processing dozens of plates a day. Whatever tool you choose, the discipline that matters most is consistency: use the same normalisation method and acceptance thresholds across an entire screening campaign, not a different approach for each batch of plates.
Case studies: how optimisation choices played out in drug discovery
Kinase inhibitor screening programmes illustrate the QbD principle well. Early biochemical kinase assays frequently suffered from ATP concentration sensitivity, a critical process parameter that, left unmapped, produced inconsistent IC50 values between screening batches. Mapping ATP concentration against enzyme concentration through a response surface design, rather than optimising each in isolation, identified an operational window where potency rankings stayed stable across a tenfold range of ATP variation.
Cell-based reporter assays for GPCR signalling show a different lesson: the same reporter construct can behave differently depending on cell passage number, a variable easy to overlook until reproducibility problems appear months into a campaign. Programmes that built passage number into their robustness testing from the outset avoided the costly discovery, partway through a screen, that their hit rate had drifted for reasons unrelated to the compounds themselves.
Antibody-based immunoassays for biomarker quantification carry their own recurring lesson. Assays validated against a single reference lot frequently fail when a new antibody lot is introduced, because lot-to-lot variation in affinity or specificity was never characterised as part of the original validation. Building lot-to-lot bridging studies into the initial development plan, rather than treating them as an afterthought when a new lot ships, is the single change that most consistently prevents mid-campaign disruption.
Regulatory considerations and documentation for assay development
Regulatory expectations scale with intended use. An assay supporting a formal decision, such as biomarker qualification or a submission to a regulatory authority, requires full validation against ICH Q2(R2) criteria: specificity, accuracy, precision, and robustness, each documented against a predefined acceptance criterion set before testing began.
For internal research use, Eurachem’s guidance allows a more proportionate approach, matching validation depth to the analytical requirement rather than defaulting to full validation for every assay. The key documentation discipline is the same regardless of scale: a written SOP, a validation protocol defining acceptance criteria in advance, and a validation report recording actual results against those criteria, including any deviations and their justification.
Version control matters more than most labs treat it. Every SOP revision needs a change log stating what changed, why, and what re-validation (full, partial, or cross-validation) was performed to confirm the change did not affect performance. Auditors and reviewers look for this trail specifically; its absence is one of the most common findings in laboratory quality audits, regardless of the underlying science being sound.
Assay transfer and inter-laboratory reproducibility strategies
Transferring a validated assay to a new site, a contract lab, or a different operator team is where documentation quality gets tested hardest. The receiving laboratory needs the full SOP, the validation report, reagent lot details with provenance, and access to the same or equivalently validated controls, not a summary protocol with the details assumed.
Bridging studies are the practical tool for confirming transfer success: running a defined panel of samples, including reference standards and known positive and negative controls, at both the originating and receiving site, then comparing results against predefined acceptance criteria. A bridging study that only compares means without examining precision across the full range risks missing a systematic bias that only appears at the assay’s limits.
Interlaboratory reproducibility depends heavily on reagent consistency. If the transferring lab sources antibodies or kits from a different lot, or worse, a different supplier, than the originating validation, expect performance drift even with an identical protocol. This is precisely why provenance documentation, tracking exact lot numbers and supplier validation data at the point of original development, pays off during transfer: it gives the receiving lab a known baseline to match rather than a guess.
Where possible, build the transfer plan into the original validation protocol rather than writing it retrospectively once a transfer is already underway. Labs that anticipate multi-site use from the start typically build in wider robustness testing ranges, which smooths the transfer process considerably later.
Author perspective: what QbD and reagent provenance actually change
The gap between assays that survive scale-up and those that do not rarely comes down to cleverness. It comes down to whether CQAs were mapped before optimisation started, and whether every reagent lot was documented as it was used. Teams that build both habits early spend markedly less time on reruns, because the failures that do occur are traceable rather than mysterious. Validated reagent sourcing, the kind ABMIUM provides through pre-purchase validation, removes one entire category of guesswork from that process.
— Veron
How ABMIUM supports assay development from reagent to validation
Reagent uncertainty is the recurring failure point across everything above, from antibody selection through inter-laboratory transfer. ABMIUM addresses that directly by combining verified antibody sourcing with pre-purchase validation and transparent provenance documentation, so you know a reagent’s lot history and application data before it reaches your bench, not after a failed run forces you to investigate.
The catalogue covers the practical building blocks this guide has walked through: primary antibodies such as the Anti-Human CD276 Antibody [6A1], detection systems including the Polymer-HRP Anti-Mouse/Rabbit IHC Detection System (DAB solution), and secondary antibodies like the Anti-Rat IgG Antibody [Poly1441]. Beyond the catalogue, ABMIUM offers custom antibody and assay development services and independent validation for reagents you already hold, backed by institutional contract pricing for labs running regular screening programmes. For antibody developability considerations beyond provenance alone, InnovaBiotech’s blueprint on discovery-stage assessment is a useful companion read.
If reagent-driven reruns have been eating into your validation timeline, view the Anti-SA Antibody [15E6] product page to see the provenance detail ABMIUM documents, or get in touch to request a custom validation quote for your current assay.
Essential standards and manuals to consult
For deeper technical grounding, four sources anchor this guide: ICH Q2(R2) sets the regulatory validation standard, the Assay Guidance Manual covers practical development philosophy, Eurachem’s guide frames proportionate validation for research use, and the HTS overview on Wikipedia sets realistic throughput expectations for automated screening.
Sources
FAQ
What is assay development?
Assay development is the process of designing, optimising, and validating a measurement method so it reliably detects or quantifies a target analyte for a specific research or screening purpose.
What do we mean by an assay?
An assay is a laboratory procedure that measures the presence, amount, or activity of a substance, such as a protein, enzyme, or compound, typically producing a quantifiable signal like absorbance or fluorescence.
What are the four stages of drug development an assay typically supports?
Assays support target validation, lead identification (often through high-throughput screening), lead optimisation, and preclinical or clinical candidate confirmation, with validation requirements increasing at each stage.
What are the main types of assays?
The main categories are biochemical assays (isolated molecular interactions), cell-based assays (pathway or receptor activity in living cells), and phenotypic assays (functional outcomes without a defined molecular target).
How do I know if my assay is validated well enough to screen?
Check your Z’-factor sits above 0.4, ideally above 0.6, alongside documented specificity, precision, and robustness data against predefined acceptance criteria, following a framework such as ICH Q2(R2).